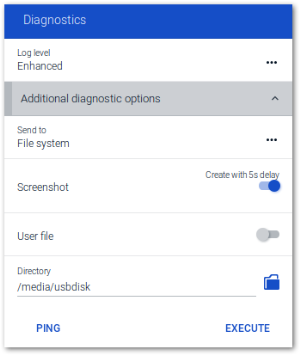
Diagnostics dialog
The following diagnostic options are provided:
- Enhanced log level: Configuration and log files are retrieved to a greater extent
- Additional diagnostics by creating screenshots or adding further freely selectable files
- Display or send relevant files to FTP server, Scout Server or data medium
- Ping command to check connectivity and latency in your network
| Option | Description | ||||||||
|---|---|---|---|---|---|---|---|---|---|
| Log level | Choose between Standard and Enhanced for different amounts of configuration and log files. Use the Enhanced log level only temporarily, otherwise you risk exceeding the flash memory capacity of your device. |
||||||||
| Send to | Configure the destination: Where do you want to send the files?
|
The following options are only visible after you have chosen a destination (except Display):
| Screenshot (only if destination ≠ Display) | After you click Execute, with a 5 second delay, a screenshot is taken and transmitted with the diagnostic files. Screenshots are created as .png files under /tmp. |
| User file (only if destination ≠ Display) | Users can select a local file to be transmitted with the diagnostic files. |
| Directory / server address (only if destination ≠ Display)) | File system directory or server address (Scout Server or FTP-Server) for transmission of the diagnostic files |
| Ping | Allows users to ping any host (IP address or FQDN)1 |
| Execute | Displays or sends the selected amount of diagnostic files to the configured destination |
If the destination is not Display, the diagnostic files are organized in directories such as setup, var, tmp and sent in a .zip file.
The systemd-journal.log (Enhanced log level) logs network activities.


