Dashboard
– from SCG 1 2209 –
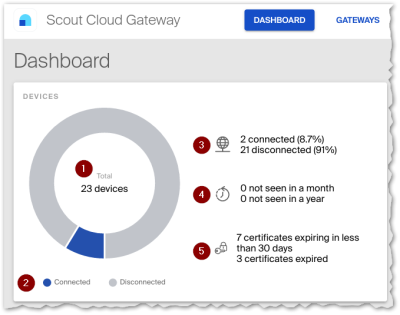
In the SCG Dashboard, various widgets show the most important key figures and key performance indicators so that you can get an overview of the entire infrastructure at any time.
Devices
| 1 | Total number of all connected devices |
| 2 | Currently connected and disconnected devices |
| 3 | Number of connected and disconnected devices |
| 4 | Devices that have not been connected for at least one month / at least one year |
| 5 | Devices whose device certificate has expired / will soon expire |
Load Balancing
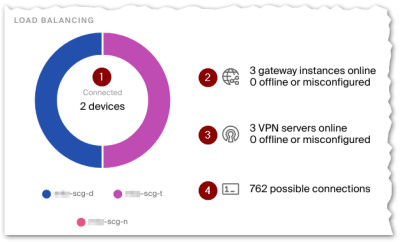
| 1 | Total number of all connected devices with current distribution to instances |
| 2 | Number of gateway instances that are currently online, offline, or not configured Unconfigured gateway instances can be freshly installed instances or disabled instances. |
| 3 | Number of VPN servers on the gateway instances that are currently online, offline, or not configured If a VPN server is not configured, Configuration > Gateways > Gateway-specific configuration is missing. |
| 4 | Total number of possible device connections with display of instances that have only a few free IP addresses left |
Performance
Average CPU and RAM usage, as well as memory across instances.
The instance with the highest values is displayed.
Configuration

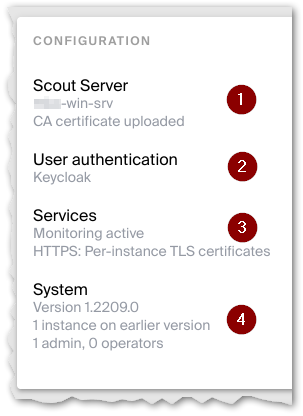
|
|
Administrator activities
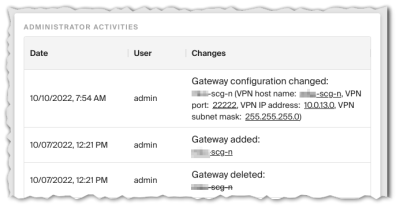
Various activities are logged, including configuration value changes and adding/changing/deleting gateway instances.
The old values are crossed out, the new ones are underlined.


